The Data tab
The readings behind the charts, with what the app found when it read your file.
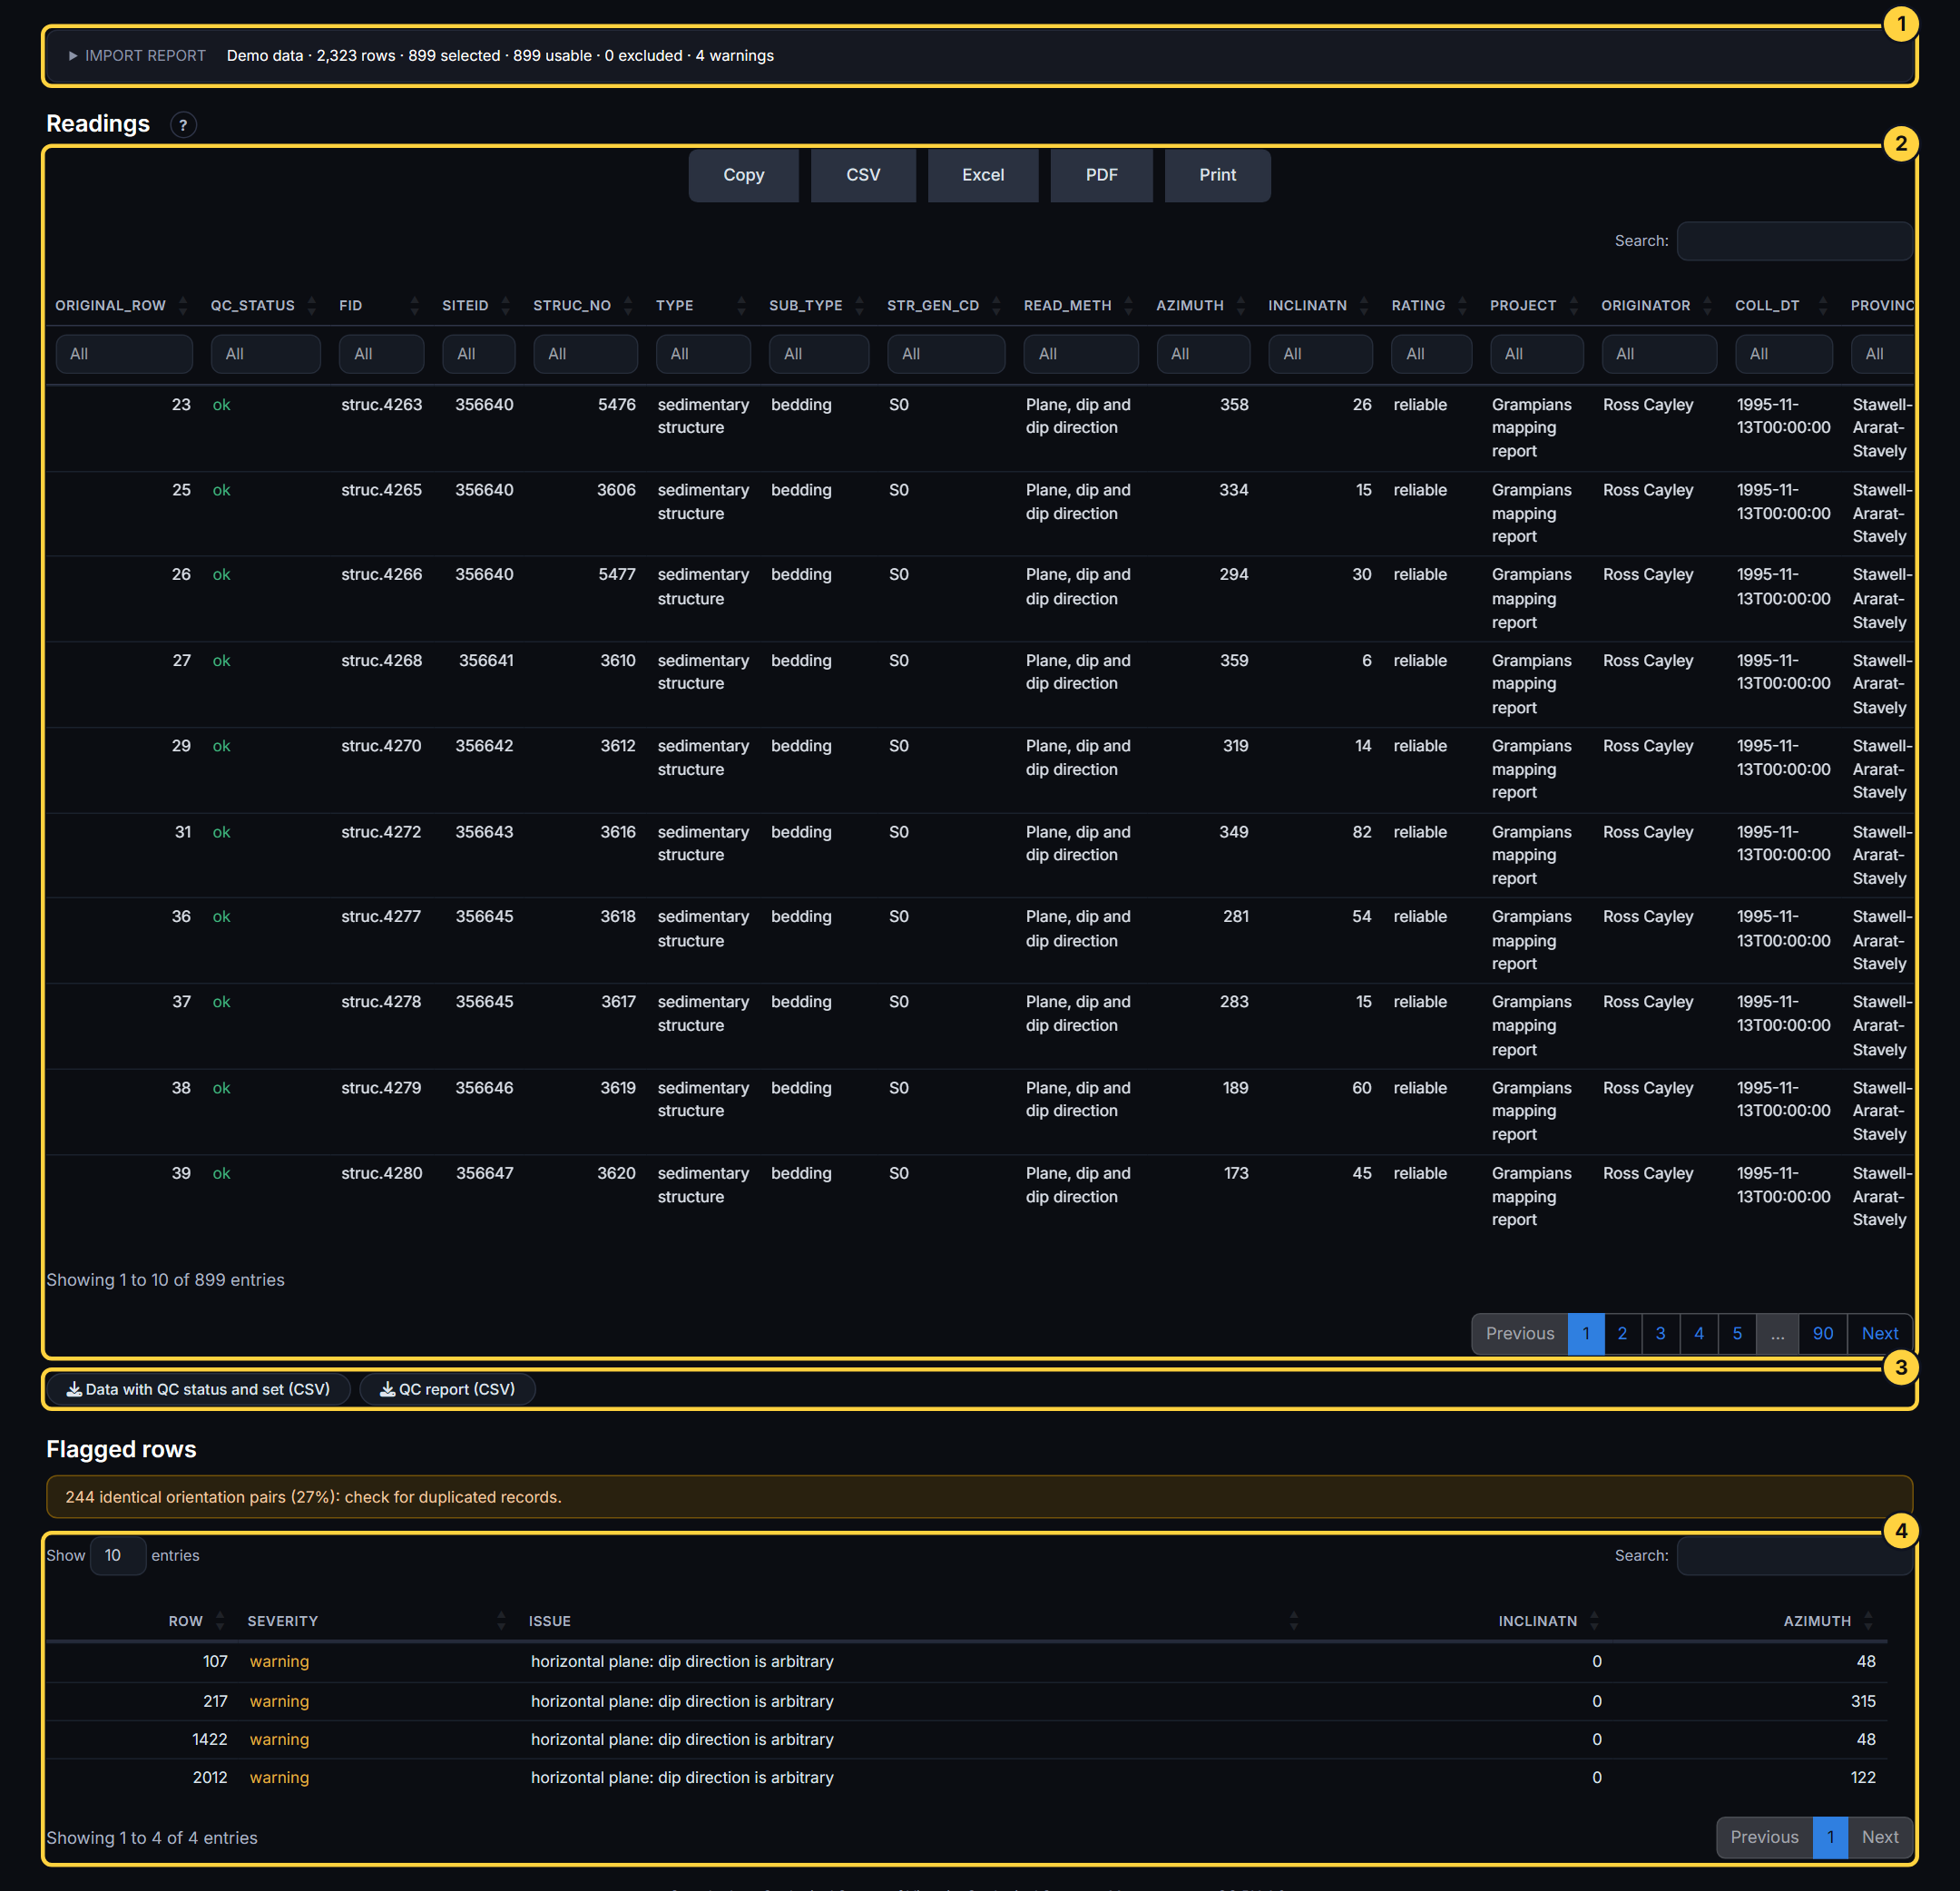
- Import report: What was read: the file, the rows, and everything worth checking (empty columns, repeats, values out of range, text that could not be read).
- Readings: The table: search, sort, and copy or download as CSV, Excel or PDF.
- Downloads: The readings with a quality-control status and orientation set, and the quality-control report.
- Flagged rows: The rows that failed a check, each with the reason, and what was excluded from the analysis.