The Charts tab
The menu on the left fine-tunes the chart: its controls change with the chart chosen. The chart area shows the chart, its statistics and how it’s worked out.
Chart menu: Precision
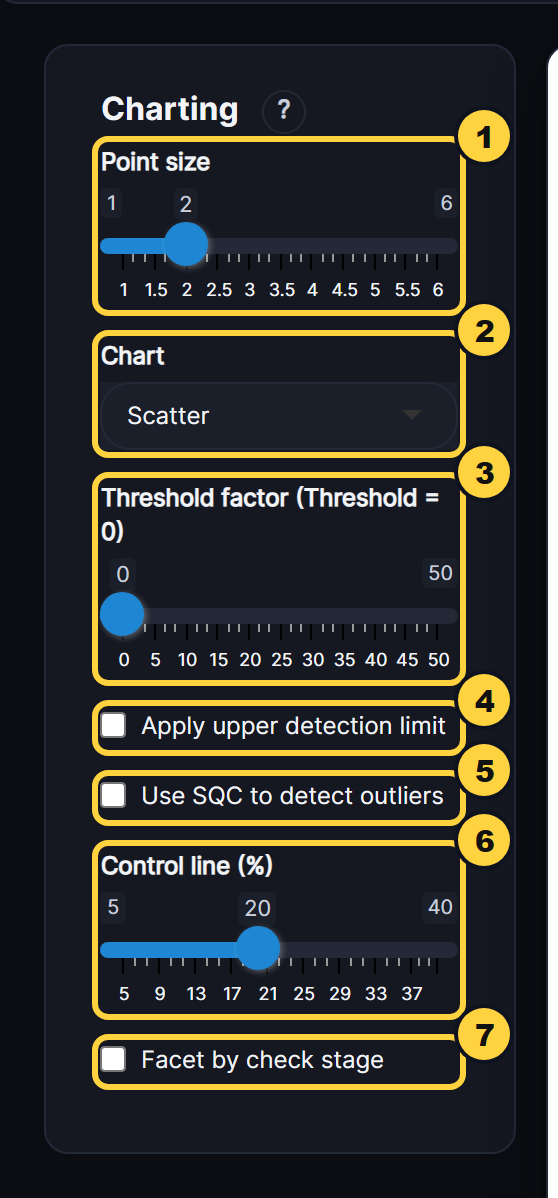
- Point size: The size of the points on the chart.
- Chart: The chart type. Each QC type has its own list, from scatter and RD charts to Thompson-Howarth.
- Threshold factor: Multiplies the detection limit (LLD) to give a threshold. Pairs below it are greyed out and left out of the statistics and control lines.
- Apply upper detection limit: Leaves out pairs where either result exceeds the upper detection limit (only where the data gives one).
- Use SQC to detect outliers: Uses statistical control (the 3 SD action limit; the 2 SD warning band is also shown) instead of the manual control lines to find outliers.
- Control line (%): The relative difference (%) the manual control lines are drawn at.
- Facet by check stage: One panel per check stage, side by side.
Chart menu: Accuracy
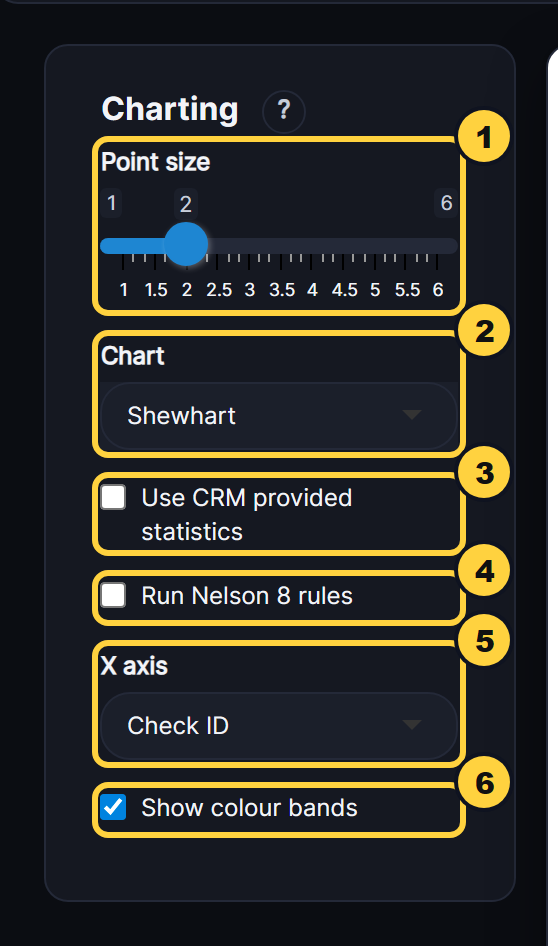
- Point size: The size of the points on the chart.
- Chart: The chart type: Shewhart, CUSUM, EWMA, Z-Score and more.
- Use CRM provided statistics: Builds the control lines from the CRM’s certified value and standard deviation, instead of the ones computed from the results.
- Run Nelson 8 rules: Flags runs and trends that suggest the process is out of control, with a table of which rules were broken.
- X axis: What runs along the bottom: Lab Job No, Despatch No, Check ID or Date.
- Show colour bands: Shades the bands: within the 2 SD warning limits (green), between warning and 3 SD action limits (amber) and beyond (red).
Chart area
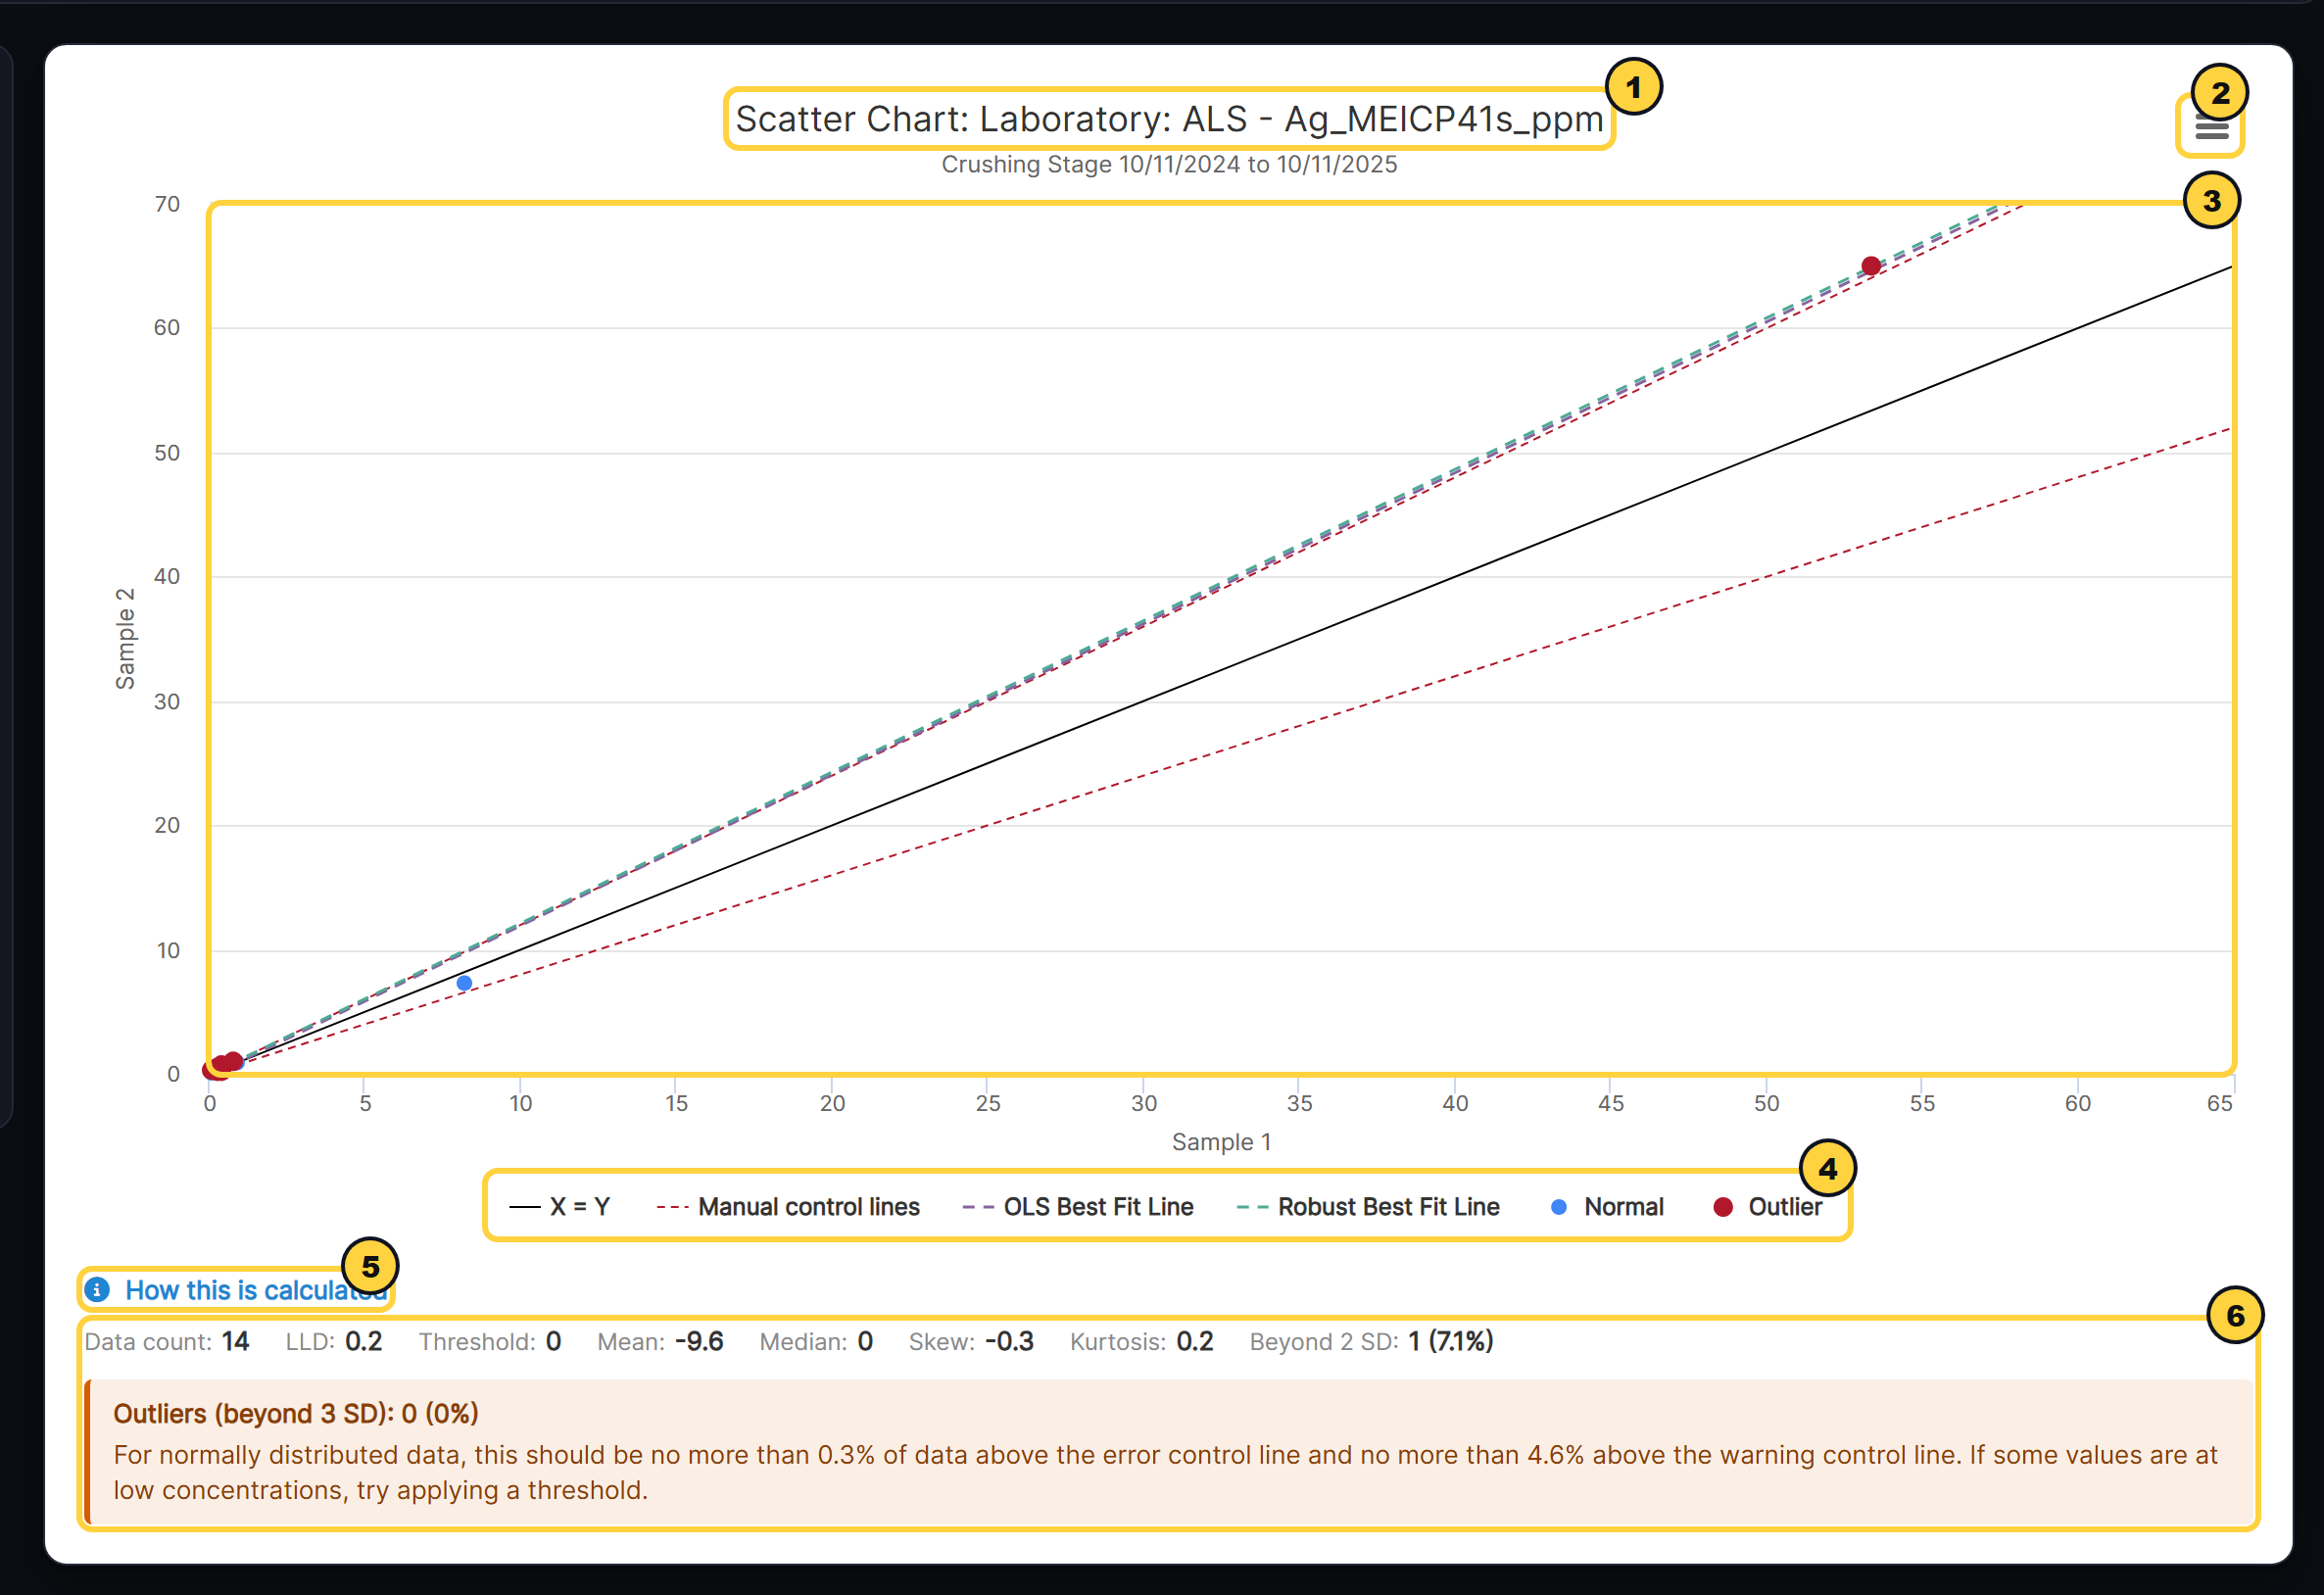
- Title: The chart, laboratory and analyte, with the check stage (or CRM) and dates underneath.
- Chart menu: Full screen, print, and download as an image or the data behind it.
- The chart: Point at a result to see its details.
- Legend: Click an item to hide or show it.
- How this is calculated: The method behind the chart, with this chart’s own numbers.
- Statistics: The chart’s statistics, with notes on what they mean - how many outliers to expect, for example.